 by David Vines, GIS Associate
This month, we received great news for Grand Staircase-Escalante National Monument. The Interior Board of Land Appeals overturned the Bureau of Land Management (BLM)’s plan to tear out more than 30,000 acres of pinyon and juniper forest in the heart of the monument.
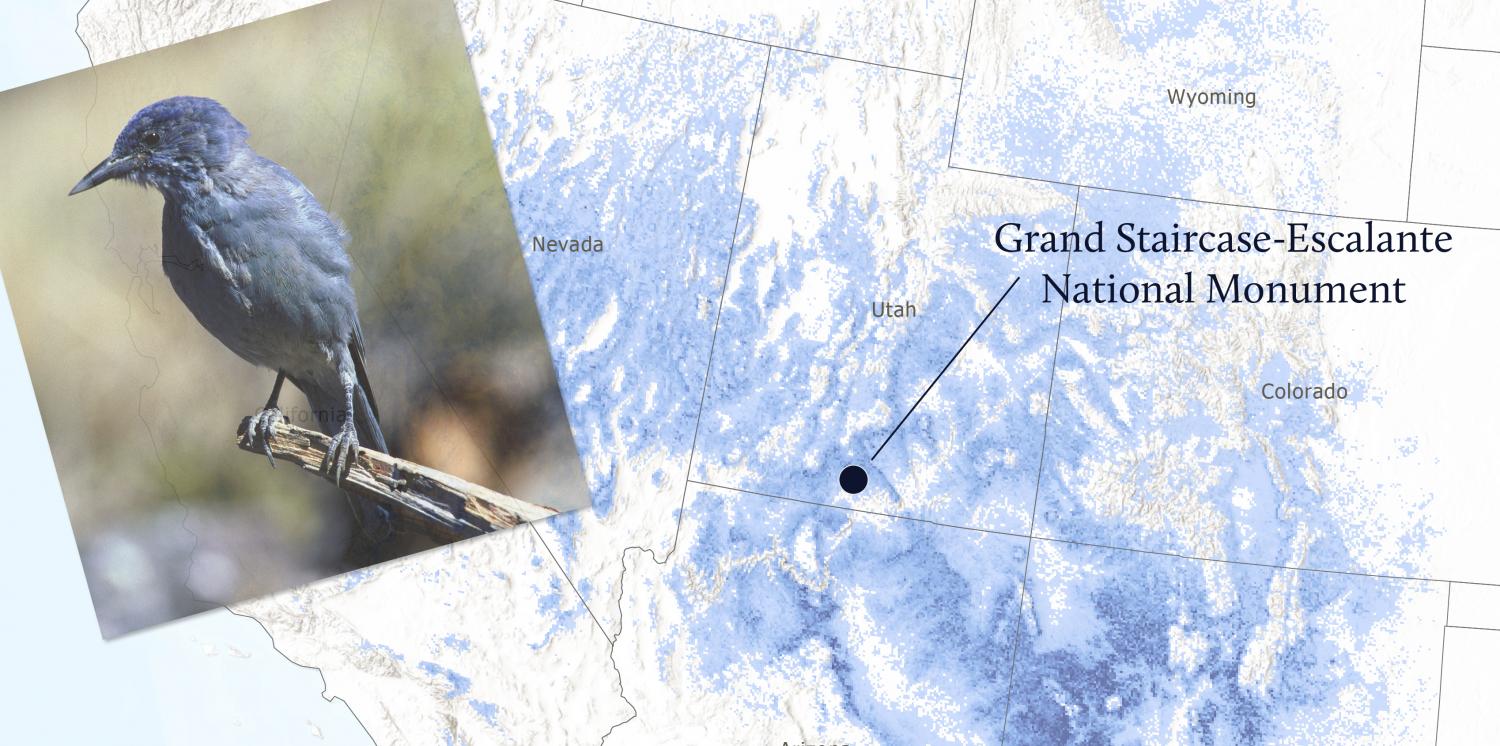
In overturning the so-called Skutumpah Project, the board cited the BLM’s failure to account for the project’s adverse effects on migratory birds. Using Geographic Information Systems (GIS), we can see where pinyon jays are predicted to live and compare that area to the proposed project boundaries. Visual tools like maps help us better understand the forests and where proposed management actions might have the most impact.
Here’s a glimpse of the idiosyncratic craft of cartography and the journey we took to map the habitat of the little blue bird that lives in Grand Staircase-Escalante National Monument.

The data hunt
Finding data can be the most troublesome task for a cartographer. In our internet age there is an enormous amount of publicly available data for mapping, yet finding the right data for a specific map can be elusive.
At the outset, I thought I knew of a great source for pinyon jay range data. But it turns out the source had embargoed the use of its data for the time being. Stymied, I continued my search.
After some hunting, I found eBird, an organization associated with the Cornell Lab of Ornithology. It uses data collected by birdwatchers across the country to map the relative abundance of bird species.
A great new data source that provided exactly what I needed? There had to be a catch.
There was.
Like pinyon jays have to crack hard shells of pine nuts, I had to break open the eBird data using a coding language called R — an open source programming language primarily used by the scientific community. Following eBird’s excellent documentation and leaning on my grad school days, I was able to extract the data I needed. If the screenshot of my R document below doesn’t look complicated, believe me, it is.

Finding data is a process in and of itself, but it’s just the first step. I needed to better understand what it meant. eBird’s data is presented in an interesting way — it shows “relative abundance,” defined as the chances of seeing a particular bird within one hour on a one kilometer walk.
I am not a birder, much less a skilled one, but in the midst of mapmaking, I found myself wishing I could go to Grand Staircase-Escalante National Monument with experts and see what bird species we could find. This thought gave me another idea — to show known observations of pinyon jay on the map too.
The U.S. Geological Survey built a tool called BISON that provides data on plant and animal observations (the acronym is a bit of a misnomer, I know). Using BISON, along with eBird’s relative abundance, we can see that many recorded observations of pinyon jay overlap with where the BLM was proposing to rip out, cut down, and otherwise remove pinyon and juniper trees in Grand Staircase.

Cartography for a cause
The comparison between the BLMs proposed project, where pinyon jays are predicted to live, and past sightings, highlights exactly what we risk losing by clear cutting pinyon and juniper forests. And the maps help illustrate that removal of trees in these areas will likely have a lasting impact on pinyon jays in Grand Staircase.
Cartography, like conservation, is easier said than done. I hope that making maps can help all of us better understand the Colorado Plateau and make protecting it easier.
As 2024 draws to a close, we look back at five maps we created this year that give us hope for 2025.
Read MoreFour of the five most dangerous sections of the haul route are on the Navajo Nation.
Read MorePronghorn and barbed wire fences don't mix, but volunteers are working to change that, one wire at a time.
Read More